
")
The primary focus of this article is Avery Dennison Corporation (NYSE: AVY).
Investment Thesis
Actions of institutional investment organizations in managing their multi-billion-dollar stock portfolios require the negotiating help, and often temporary liquid capital assistance, of Market-Makers [MMs] shorting shares in the prompt, low-disturbance round-up of desired shares of identified promising companies.
MM risk-avoidance hedging requirements continually drive derivative market prices, revealing in the limited-life legal contracts traded there the underlier stocks' price-range extremes regarded as likely by the well-informed sellers and buyers of the related risk protections. They are informed by over 100,000 worldwide wide-eyed and keen-eared MM employees on a 24x7x365 watch for a change in competitive circumstances. Changes get immediately communicated to the home-base trading desks.
Following an unchanging risk-minimizing portfolio management discipline, we keep records of how insightful the maintained bits of intelligence flow have been on each of thousands of subject stocks over decades of daily observations. Those records provide the basis for making intelligent transactions about likely coming prices of specific securities, in the near-term.
Company Description
“Avery Dennison Corporation operates as materials science and digital identification solutions company. It provides branding and information labeling solutions, including pressure-sensitive materials, radio-frequency identification (RFID) inlays and tags, and various converted products and solutions. The company designs and manufactures a range of labeling and functional materials that enhance branded packaging, carry or display information that connects the physical and the digital, and improve customers' product performance. It serves an array of industries, including home and personal care, apparel, e-commerce, logistics, food and grocery, pharmaceuticals, and automotive worldwide. The company was formerly known as Avery International Corporation and changed its name to Avery Dennison Corporation in 1990. Avery Dennison Corporation was founded in 1935 and is headquartered in Mentor, Ohio.”
Source: Yahoo Finance
Yahoo Finance
The Big Picture: Risks vs. Rewards
Investment portfolio candidate competitors to AVY include companies in the Packaging Security industry.
Figure 1
blockdesk.com
(used with permission)
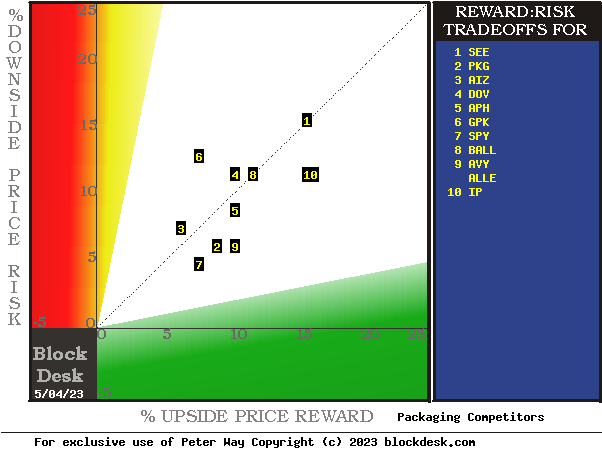
The tradeoffs here are between near-term upside price gains (green horizontal scale) seen worth protecting against by Market-makers with short positions in each of the stocks, and the prior actual price drawdowns experienced during holdings of those stocks (red vertical scale). Both scales are of percent change from zero to 25%.
The intersection of those coordinates by the numbered positions is identified by the stock symbols in the blue field to the right.
The dotted diagonal line marks the points of equal upside price change forecasts derived from Market-Maker [MM] hedging actions and the actual worst-case price drawdowns from positions that could have been taken following prior MM forecasts like today.
This map of price change potentials places better-tradeoff candidates in the directions of down and to the right. The “frontier” of currently most-capable stocks for near-term gains begins with SPY at [7] and continues to AVY at [9] and up to IP at [10]. Our principal interest is in AVY, the visually most appealing security here.
These forecasts are implied by the self-protective behaviors of MMs who must usually put firm capital at temporary risk to balance buyer and seller interests in helping big-money portfolio managers make volume adjustments to multi-billion-dollar portfolios. Their protective actions define daily the extent of likely expected price changes for thousands of stocks and ETFs.
This map is a good starting point, but it can only cover some of the investment characteristics that often should influence an investor's choice of where to put his/her capital to work. The table in Figure 2 covers the above considerations and several others.
Comparing Alternative Investments
Figure 2
blockdesk.com
(used with permission)
Readers familiar with our evaluation process may choose to skip from here to the next section showing current half-year daily forecast trends in EXPECTED PRICE RANGES for AVY – Figure 3.
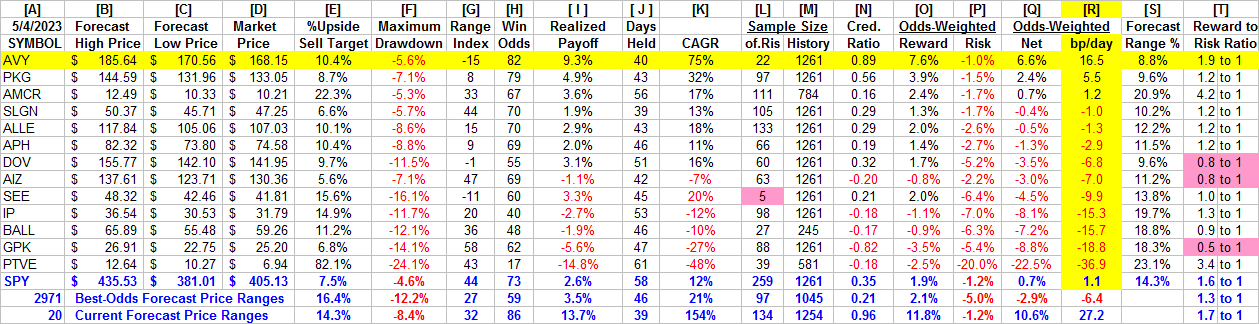
The price-range forecast limits of columns [B] and [C] get defined by MM hedging actions to protect firm capital required to be put at risk of price changes from volume trade orders placed by big-$ “institutional” clients.
We then use market actions subsequent to the prior appearances of up-to-down balance prospects like those of this day.
[E] measures potential upside risks for MM short positions created to fill such orders, and reward potentials for the buy-side positions so created. The buy-side risks actually encountered from prior forecasts like the present are in [F]. There are shown the most severe loss moments encountered during holding periods in an effort to reach [E] gains. Those are where buyers are most likely to accept losses.
[H] tells what proportion of the [L] sample of prior like forecasts have earned gains by either having the price reach its [B] target, or be above its [D] entry cost at the end of a 3-month max-patience holding period limit. [ I ] gives the net gains-losses of those [L] experiences and [N] suggests how credible [E] may be compared to [ I ].
Further Reward~Risk tradeoffs involve using the [H] odds for gains, with the 100 – H odds as loss weights for N-conditioned [E] and for [F], for a combined-return score [Q]. By using the typical position holding period [J] on [Q] we have a figure of merit [fom] ranking measure [R] useful in portfolio position preferencing. Figure 2 is row-ranked on R among candidate securities, with AVY in top rank.
On the same standards of comparison none of the alternative stocks approach the form [R] of AVY at 16+ basis points per day, a CAGR annual growth rate of +75%.
Among the 20 best-ranked of all 2971 of today's MM price-range forecasts, their realized payoffs of 9.3%, Win Odds (82 of 100), and holding periods (40 days) are less than the forecast population's best but offer well-above average interim rewards.
Recent MM Price-Range Forecast Trends for AVY
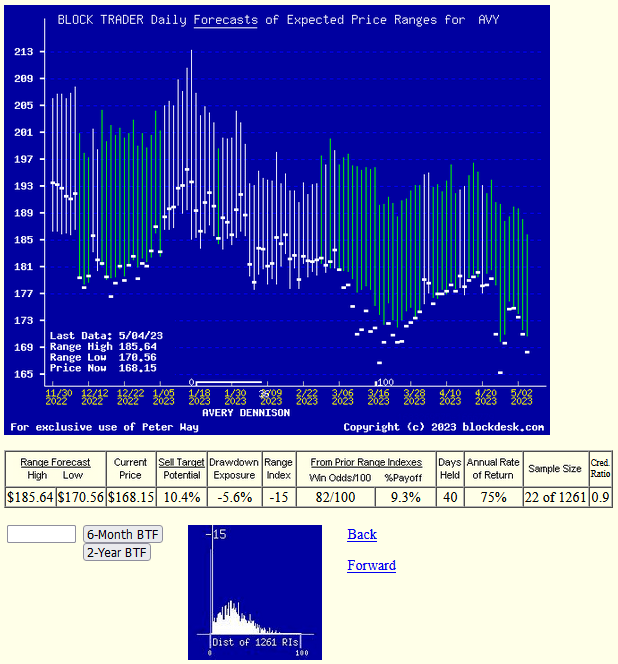
The current week's combined easing in market quotes and modes expansion of coming-price expectations provide AVY with improved competitive investment comparisons to alternatives. Figure 3, unlike “technical analysis charts” shows daily forecasts of coming likely price ranges, rather than past actual days' prices.
Those forecast price ranges are split into the upside and downside prospects by the issue's closing price of the current-day forecast. The Range Index tells what percentage of that range lies below the current market price. This clear definition of expected price risk in relation to prospective upside price for all stocks makes comparisons between alternative portfolio candidates much easier to evaluate than most nebulous references to “risk” when what may be referred to is merely poorly defined “uncertainty” of the future.
Figure 3
blockdesk.com
(used with permission)
The “thumbnail” lower picture in Figure 3 shows the distribution of the past 5 years of daily MM forecasts in terms of the market's then-current price quote for AVY relative to its upper and lower limits. The current Range Index of -15 indicates that the stock is market-priced below the range of reasonable value.
The frequency of the past 5 years' daily Range Index value provides a clear visual idea of the dominant odds for higher coming prices in coming weeks and months.
Conclusion
Avery Dennison Corporation (AVY), as seen by the market-making community, appears to be the currently most attractive online packaging technology stock for near-term capital gain among leading competitors.


